Reliable Identification of Counterfeit Spirits
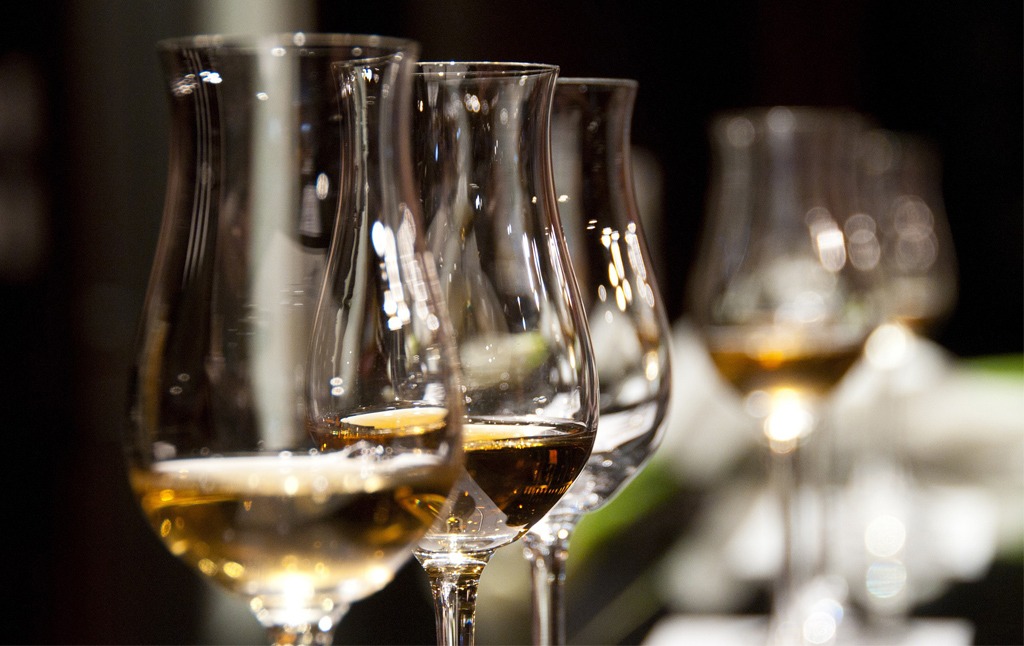
Have you ever heard that moonshine will make you go blind? Today, even your favorite, top-shelf liquor may be just as much of a risk.

During the Prohibition era in the U.S., it was not the home distilled liquors that were dangerous. To increase profits, cheap and poisonous industrial alcohols were added to spirits, often leading to blindness and death. Similar practices exist today, with estimates that 30 percent of the alcoholic beverages consumed in the world are illicit, risking manufacturers’ brand reputations and consumers’ health.
Everywhere we look in industry we see issues with counterfeit, adulterated, or knock-off products. The alcohol industry is no different. Adulterants include both inexpensive solvents for removing paint and ethyl rubbing alcohols with the same intoxicating component as alcoholic beverages (ethanol), but intentionally have contaminants (denaturants) to make them unsafe for human consumption.
Common intentional additives in these denatured alcohols are methanol, methyl-ethyl-ketone and iso-propyl alcohol. Depending on concentration, denaturants are exempt from quality processes and costly taxes, which make them attractive to counterfeiters.
Experiment Overview
To assist spirits distributors and distillers alike, reliable spectral sensing technology has been developed to identify counterfeit liquors. Previous studies by Ocean Optics have demonstrated that brands of whisky and liquors produce specific UV-Visible range spectra (see our video on spirits sampling and learn more about our legacy system), but the UV-Visible range cannot be used to differentiate among different alcohols with the necessary precision. Here we investigate the feasibility of using a mid-infrared spectral sensor to detect small amounts of denatured alcohol in liquors. Ocean Optics’ new MZ5 is a mobile, on-site device that can give real-time results with no sample preparation. The Ocean MZ5 is a miniature ATR spectrometer with measurement capabilities from 1818-909 cm−1 (5.5-11 μm). This fully self-contained instrument — including sample interface, light source and detector — provides a compact, fast and scalable alternative to traditional FTIR spectroscopy.
Experiment Setup
For this proof-of-concept stage, methanol (MeOH) and iso-propyl-alcohol (IPA) were added to “liquor” samples. These “liquor” samples are a synthetic ethanol-water mixture, akin to vodka (40% volume ethanol, 60% volume water). Contaminated “liquor” concentrations for each denaturant of values 0,1,2,3,4 (% volume) were created with care. In just a few minutes several hundred spectra were taken of each sample and averaged, then plotted together to produce the smooth spectra below. You can see there are spectral regions for both IPA and MeOH that show all the concentration gradients.

Figure 1: All Calibration Spectra
 Figure 2: All Calibration Spectra
To further reveal the real potential of the spectra and increase the visual resolution, spectra for each concentration were subtracted from the average of all contaminated concentrations to amplify regions of variance. These plots highlight the MZ5’s ability to distinguish among samples. What was difficult to distinguish by eye in the first set of graphs, now appears quite separate.

Figure 3: All Centered Spectra colored by concentration

Figure 4: All (potentially) Scaled and/or Centered Spectra (as indicated) colored by concentration
From here a Pearson Product Correlation (mathematical process) study was done to identify spectral regions of interest and access their feasibility for extrapolating trends. Areas where the blue correlation line reaches 1 or near to 1 are great candidates for chemometric development, because they correlate correspondingly with the concentrations. Areas below zero are regions where the signal correlates negatively with the known concentrations. The red spectrum line is shown for visual reference.

Figure 5: Correlation between concentration and spectra

Figure 6: Correlation between concentration and spectra
Below are the concentration prediction trend validations of the models written using Partial Least Squares “PLS” chemometrics based on the regions identified above. Several variations at different complexity levels (number of components) were attempted; the ones with the lowest error distribution were selected. The plots positively demonstrate the feasibility of this study. The trends are shown to have error below 0.13% (Volume), more than sufficient to identify liquors contaminated by industrial grade ethanol.

Figure 7: Predictions of the concentration with the calibration spectra

Figure 8: Predictions of the concentration with the calibration spectra
Discussion
Typically, concentrations around 5% denaturant in pure ethanol are required to qualify as tax-free denatured ethanol and are meant for industrial use only. Adulterated liquors often contain the maximum tolerable concentration from a safety prospective of 2% denaturant. This is 4 times the government recommended amount of 0.5%. While this initial study was limited to synthetic vodka as the “liquor,” the accuracy results of 0.13% (Volume) are very encouraging and 5 times below the limit needed for identification.
When compared to traditional methods using an FTIR spectrometer with ATR accessory, the MZ5 is more compact, fitting into an easy carrying case small enough to be a personal item on an airplane; is more robust, with no moving parts or mirrors that can go out of alignment; and is more affordable. Also, for example, the MZ5 could be customized for use by retailers or distributors at the point of sale to authenticate liquors, preserving the reputation of the manufacturer, the safety of the consumer and the taxes due to the government.