Biological tests and processes have seen a recent burst in attention from a range of new technologies hitting the mainstream, such as custom-engineered medical treatments and at-home genetic tests.
The global DNA sequencing market alone is expected to grow by 18% in the next decade1, and processes of today will need to be scaled and advanced appropriately to keep up. No matter what specific biological test one may be dealing with, UV absorbance is commonly used to determine the concentration of a constituent.
Depending on your sample and application, you may need UV protein detection at very low limits or at extremely thick concentrations. The power to perform accurate measurements at both extremes is found in the Ocean HDX spectrometer, which provides excellent resolution at normal light levels as well as stable readings at the lowest intensities. Internal optical baffling and intelligent processing minimize stray light effects, and using the platform with variable pathlength cells allows the user to tailor specific concentration ranges as desired.
Here we look at the ability of the Ocean HDX to measure concentration of bovine serum albumin (BSA) in a 0.5 mm pathlength flow cell. This could be useful during mobile-phase detection in an HPLC system, or for concentration analysis of an ongoing biological growth process.
Also, Ocean Insight offers high-powered LEDs across the UV-Visible-NIR range, and these couple perfectly with the Ocean HDX to provide enhanced dynamic range in absorbance readings. Add a UV LED, sampling accessories and software to create a ready-for-purchase protein concentration measurement package (at left below).
Aqueous solutions of bovine serum albumin were generated from 5 g/L up to 80 g/L using reverse osmosis (RO) water and BSA obtained from Millipore-Sigma. A peristaltic pump was used to drive the solutions through the flow cell for absorbance analysis, with blank RO water used as the light reference.
By flowing these solutions through the 0.5 mm cell using the 280 nm LED source, we see clear and smooth UV absorbance trends as a function of concentration. More importantly, the linearity of these measurements maintains a 0.9997-R2 value up to 2.8 AU and potentially beyond.
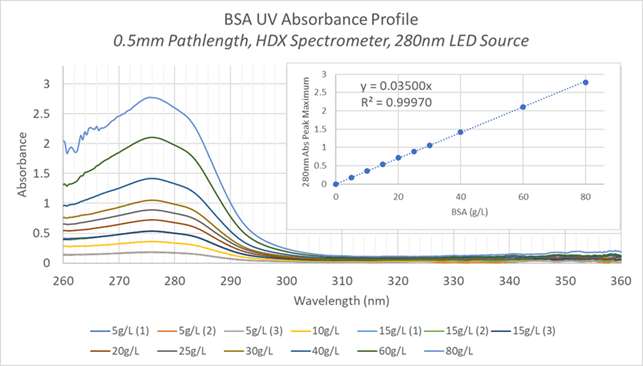
Having this level of linearity across such a vast absorbance range allows for accurate detection over 3 orders-of-magnitude of concentrations, from 0.8 g/L to 80 g/L. Keep in mind that at 2.8 AU, this is stating the intensity I versus the original intensity I0 is:
I/I0 = 1 / 102.8 = 0.00158
This means that >99.8% of the original light has been absorbed at the UV wavelength being analyzed, yet we are still able to obtain stable, meaningful optical signals that fit perfectly onto the linear concentration trend. Such optical performance is why the Ocean HDX is the preferred spectrometer choice for so many applications dealing with highly variable light levels, and for customers with the need for an affordable, small-footprint instrument.
The linearity demonstrated here holds true across other wavelengths as well, and Ocean Insight provides LEDs, fibers, and sampling accessories for Visible and NIR ranges that can deliver equally valuable process information.
Click here to download this Application Note.
References
- DNA Sequencing Market Report 2019-2030 By Regional Revenue, Growth, Trends Analysis & Key Players, https://www.cmo.com.au/mediareleases/38865/dna-sequencing-market-report-2019-2030-by/