OceanView Spectroscopy Software and Analysis of Edible Oils
OceanView is the flagship software program for Ocean Optics spectrometers. Beyond simple data visualization, OceanView allows users to generate, customize and save spectroscopy projects using its Schematic View function. Saved projects can then be reloaded or shared with others. The Schematic View presents each data processing step in a diagram format with icons representing the different devices and steps in your project. In the Schematic, you can view and manipulate the flow of data from your spectrometer through each of your processing steps. Data flow is represented by the use of arrows that connect different nodes. The nodes represent points where data is processed or manipulated.
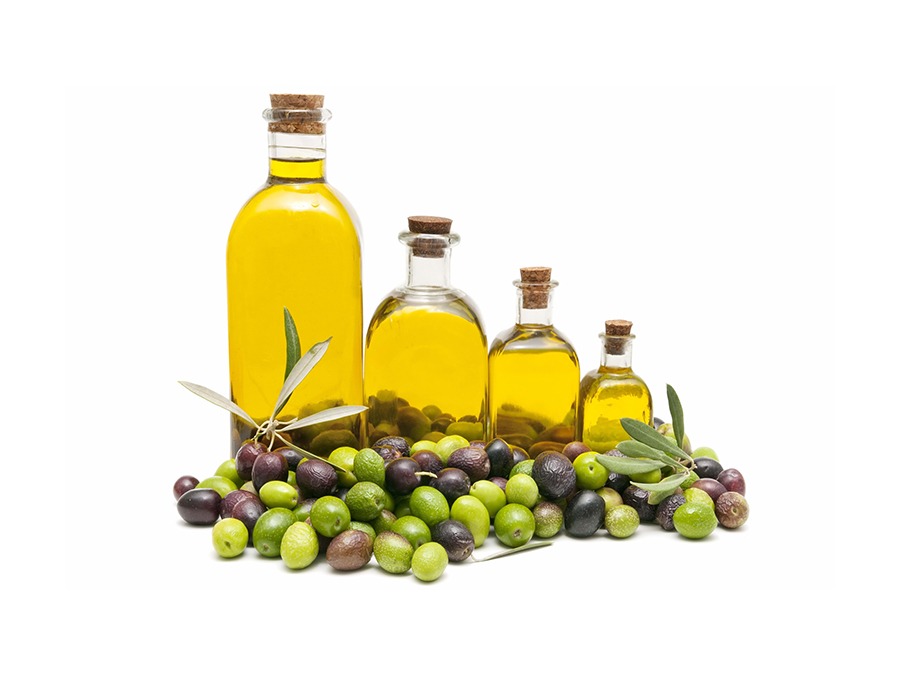
In this project, we measured the fluorescence of edible oils – canola, corn, olive, peanut and sunflower — and compared the relative fluorescence intensity for various components present in the oil samples. This is a useful technique in determining oil grade and source, detecting adulterants and quantifying chlorophyll.
About OceanView Schematic View
The Schematic View provides all of the functionality of the OceanView graph view, plus additional capabilities to customize your spectroscopy measurements:
- More than 70 algorithm nodes enabling a range of math functions for basic and advanced calculations
- Subrange node to specify a subset of the spectrum or a single wavelength
- Interpolation of spectral data to output data at consistent, evenly spaced intervals
- Scalar view for monitoring a single value such as TEC temperature or an integral or average over a specified wavelength range
- Ability to preview spectra at every step in your process
Create, configure and connect schematic nodes to read data from devices, to transform and combine that data through a library of built-in spectroscopic functions, and then to output the results to visual graphs and Microsoft Excel-ready CSV files.
Project Description
This project was created for measuring the fluorescence of edible oils and comparing the spectral features of each sample based on its composition. To make the measurements, we used a QE Pro spectrometer (200-950 nm) with LLS-365 nm LED for excitation, a CUV-ALL-UV cuvette holder and a pair of QP600-1-XSR optical fibers arranged at 90° relative to the sample.
Background
The UV-excited fluorescence spectrum measured for an edible oil sample is the combination of fluorescence arising from fatty acids, tocopherols, plant pigments, chlorophyll and other compounds found in the oil. These components combine to create a unique fluorescence fingerprint that can be used to:
- Determine the grade of edible oils
- Detect adulterated edible oils
- Authenticate the manufacturer and source of edible oils
- Quantify tocopherols, phenols and chlorophyll for edible oil quality
- Evaluate changes in edible oil quality during storage
As described in the open-access journal article “Characterization of Vegetable Oils by Fluorescence Spectroscopy” (Food and Nutrition Sciences, Vol. 2, No. 7, 2011), fluorescence analysis of edible oils ranges from the comparison of spectral fingerprints arising from excitation at a single wavelength to more detailed multivariate analysis from total luminescence or synchronous scanning techniques.
Project Overview
In this project, we compare the relative fluorescence intensity arising from fatty acids, tocopherols and other compounds to the fluorescence intensity arising from chlorophyll. This schematic of this simplified OceanView project could be expanded with additional calculations to provide more quantitative, detailed information about the composition, quality and identity of the edible oils.
OceanView guides you through the steps necessary to swap the spectrometer you are using into the project including measuring a new background spectrum. The fluorescence spectrum for edible oils occurs in the Vis-NIR wavelength range, so you must use a spectrometer configured to detect light in the Vis-NIR region for these measurements. A UV LED or other light source can be used to excite fluorescence from the edible oil samples.
When you open the Schematic, you will see that we use “SubRange nodes” — data that identifies a subset of the spectrum or a single wavelength — to specify only the intensity at 545 nm for the fluorescence arising from the combination of the fatty acids, tocopherols and other compounds (for example, beta-carotene and other plant pigments) in the oil and at 670 nm for the fluorescence caused by chlorophyll in the oil.
 The OceanView Schematic is a convenient tool for previewing spectra at every step in the experiment.
The raw fluorescence intensity for these compounds is displayed in scalar views to provide a relative estimate of the fluorescence arising from these major edible oil components. While this is a very simplified project providing information on the relative composition of the edible oils, additional calculations could be included to provide more quantitative and detailed estimates of edible oil composition.

The relative fluorescence intensity within edible oil samples varies by component. Chlorophyll response is in the region from 650-730 nm.

Olive oil has a very pronounced fluorescence response in the region associated with chlorophyll content.