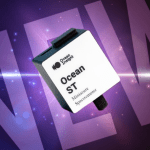
Using the MZ5 MIR Spectrometer for Ethanol Analysis
While electric vehicles are becoming more mainstream and are on the roadmap (if not production line) of every major car manufacturer, the use of traditional gasoline engines will have a place in society for decades to come. Two recurring concerns of using fossil fuels are cleanliness and efficiency; we want our fuels to have minimal impact on the environment but also want to get the most miles out of every gallon (and dollar).
Everyone is familiar with the octane rating we see at the gas pumps and the corresponding prices that follow it; this is a rating of the fuel’s ability to resist engine knocking, or pre-ignition within the chamber. As engines become more efficient they require a higher-octane rating to ensure proper operation. According to the U.S. Department of Energy, “Using a lower octane fuel than required can cause the engine to run poorly and can damage the engine and emissions control system over time. It may also void your warranty.” (Renewable Fuels Association, 2018)
Traditionally, tetraethyl lead was used as an anti-knocking agent, but this caused dramatic spikes in atmospheric lead compounds and the subsequent banning of its use. Replacement compounds such as MTBE, benzene, toluene and xylenes were an improvement from the toxic heavy metal but still brought their own degrees of toxicity (Environmental and Energy Study Institute, 2014).
Ethanol has been adopted as the primary anti-knocking agent as it offers a higher-octane rating and generates few particulates (BioEnergy Australia, 2016). Today most gasoline starts as a low-octane blendstock that is adjusted upward using ethanol (Renewable Fuels Association, 2018).
There are two primary methods of blending ethanol into gasoline including “splash blending” and “match blending.” Match blending aims to achieve some specified boiling point for the mixture, and this is primarily done with the aromatics shown in Figure 1. As a result, the emission profile for match-blended fuel is not as clean as for splash blending. Splash blending is the primary method used in the United States and is based on percent volume, specifically aiming to achieve 10% ethanol by volume in the final mix (Environmental and Energy Study Institute, 2014). In this study, we look at the MZ5’s ability to determine volume fraction of ethanol in a splash-blended fuel mixture using MIR spectroscopy.
Figure 1. Blending Octane Ratings (Source: U.S. Department of Energy and MathPro, Inc.)
About the MZ5 ATR-MIR Spectrometer
The Ocean MZ5 is both a research tool and a core technology for integration into fully customized solutions for applications such as fuel monitoring and detection of food adulterants.
For the lab, MZ5’s small size and ease of use make it an ideal benchtop/fume hood device, which is how we used it for this study. University and institutional researchers investigating biofuels and other energy sources will also appreciate the MZ5’s versatility.
For offline applications, MZ5 can anchor a devoted R&D station where process scientists analyze new additives and mixes and build spectral databases. In addition, QC stations within process lines can utilize MZ5 to spot-check fuel streams.
Experimental Setup
In the world of fuel octane ratings, the 0-mark is set by n-heptane while the 100-mark is set by i-octane, also known as 2,2,4-trimethylpentane (Compound Interest, 2016). Focusing on the latter, mixtures were made using i-octane (99.8%) and 200-proof ethanol from Millipore Sigma. The following volume fractions were prepared:
Table I.
| ϕi-octane | ϕEtOH |
| 0.00 | 1.00 |
| 0.50 | 0.50 |
| 0.75 | 0.25 |
| 0.80 | 0.20 |
| 0.90 | 0.10 |
| 1.00 | 0.00 |
Sample fluids were placed onto the crystal and measured. The MZ5’s Mirror software saved the processed absorbance spectra.
The MZ5-MIR-ATR spectrometer offers excellent spectral response from 910-1810 cm-1 and is a robust measurement system for petroleum products and general process organics. Its simplified fixed-crystal design eliminates fiber connections and the movement/vibrational issues that come with their use.
Results
Figure 2 shows the resulting spectra for the ethanol mixtures described in Table I, along with some explanations for the activities and how they relate to the organic structures.
Figure 2: Absorbance of i-Octane/EtOH Mixtures
Traditional Absorbance Model
The ethanol activity is clearly the dominant influencer to these spectra, which is highly useful in determining its concentration both in the lab and on the process line. While there are two regions of large alcohol activity, the C-O stretch band is both the largest and the most independent of the i-octane profile. Plotting the volume fraction versus this absorbance trend provides a strong correlation (Figure 3).
Figure 3: Absorbance Trend of C-O Stretch Band
If we re-reference the data around ethanol content and focus on the 1300 cm-1 alkyl methyl bending band of the i-octane, we can find a separate complementary correlation the adds value through independent redundancy (Figure 4).
Figure 4: Absorbance Trend of Alkyl Bending Band(s)
Using both correlations to back-calculate concentrations from the defining data set, we achieve better than 2% of actual value in all cases, with the 5th sample of the 50/50 mix as the only outlier (Table II).
Table II.
| Actual | Sample 1 | Sample 2 | Sample 3 | Sample 4 | Sample 5 | |
| ϕi-octane | 0.0 | 0.01 | 0.01 | 0.00 | 0.01 | 0.02 |
| ϕEtOH | ||||||
| 1.0 | 0.98 | 0.98 | 1.01 | 1.00 | 0.97 | |
| ϕi-octane | 0.5 | 0.48 | 0.48 | 0.48 | 0.47 | 0.43 |
| ϕEtOH | 0.5 | 0.52 | 0.52 | 0.51 | 0.52 | 0.57 |
| ϕi-octane | 0.75 | 0.76 | 0.76 | 0.77 | 0.76 | 0.77 |
| ϕEtOH | 0.25 | 0.23 | 0.23 | 0.23 | 0.23 | 0.23 |
| ϕi-octane | 0.80 | 0.80 | 0.80 | 0.80 | 0.81 | 0.80 |
| ϕEtOH | 0.20 | 0.20 | 0.20 | 0.20 | 0.20 | 0.20 |
| ϕi-octane | 0.90 | 0.92 | 0.91 | 0.92 | 0.91 | 0.92 |
| ϕEtOH | 0.10 | 0.09 | 0.09 | 0.09 | 0.09 | 0.09 |
| ϕi-octane | 1.00 | 0.99 | 0.99 | 0.99 | 0.99 | 0.99 |
| ϕEtOH | 0.00 | 0.00 | 0.00 | 0.00 | 0.00 | 0.00 |
Principal Component Analysis
Real-world measurements are often disturbed by some unwanted influence such as an impurity or fluctuating environmental parameter. When these disturbances translate to distortions and shifts in the spectral output there is need for more advanced correction and broadband characterization of the incoming signal. As computing power grows in both strength and general accessibility, the ability to use numerical methods such as principal component analysis on massive data sets becomes increasingly valuable and mainstream.
PCA is quite popular in many disciplines, and the world of spectroscopy is no stranger to it, either. PCA offers a quick way of classifying the incoming spectra without relying on background knowledge of the physiochemical and optochemical interactions of the system.
The plots in Figures 5-6 show the PCA distributions of the test spectra for the raw signal coming directly from the spectrometer and the corrected spectra shown in Figure 2.
Figure 5: PCA Biplot of Raw MZ5 i-Octane/EtOH Data
Figure 6: PCA Biplot of Corrected MZ5 i-Octane/EtOH Data
Interestingly, the corrected absorbance spectra, which greatly improve the R2 of traditional absorbance models, cause a very slight de-correlation when processed through PCA. We lose just a fraction of a percent of the first component’s ability to explain variations in the spectral data.
The method of standard normal variate transformation (SNV) was also performed on the data, as SNV has the potential to tighten the groupings when processed via PCA. What does become immediately apparent is the alkyl bend activity from the i-octane between 1300-1500 cm-1 (Figure 7).
Figure 7: Absorbance of i-Octane/EtOH Mixtures after SNV-Transformation
In Figure 8, we observe that with or without post-processing of the spectral data, there is not much change in the PCA distributions. This demonstrates the robust nature of the measurement system and the computational methods available to provide valuable information about your fuel blending process.
Figure 8: PCA Biplot of SNV-Transformed MZ5 i-Octane/EtOH Data
Conclusion
The MZ5 is more than a spectrometer — it is a window into the molecular structures and concentrations of the chemicals in your process stream. This simple, powerful device can provide insight into processed fuel mixtures, without sacrificing the resolution and spectral bands the fuel industry requires.
In addition, Ocean Optics can provide users with algorithm development and machine learning tools that derive additional insight from the spectral data the MZ5 collects. Tools can be developed and refined to handle complex fuel mixtures and to account for issues associated with optical interferences.
References
BioEnergy Australia. (2016). Ethanol, octane and corrosion. Retrieved from BioEnergy Australia: http://biofuelsassociation.com.au/biofuels/ethanol/ethanol-octane-and-corrosion
Compound Interest. (2016). The Chemistry of Petrol & Diesel. Retrieved from Compound Interest: www.compoundchem.com
Environmental and Energy Study Institute. (2014, October 24). How Is Gasoline Blended? Two Groups Ask EPA to Consider This Important Detail. Retrieved from Environmental and Energy Study Institute: http://www.eesi.org/articles/view/how-is-gasoline-blended-two-groups-ask-epa-to-consider-this-important-detai
Renewable Fuels Association. (2018). Ethanol’s Octane Advantage. Retrieved from Renewable Fuels Association: https://ethanolrfa.org/issues/ethanol-octane-advantage/


