Introduction
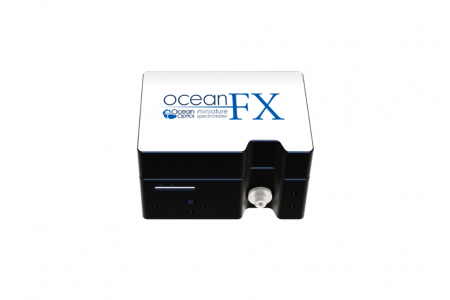
Unbeknownst to us, most of the light sources we use for general home illumination have some “flicker” associated with them, due primarily to the AC nature of the current provided for power. While this occurs at rates faster than the typical human eye can see, it can nonetheless have an impact on health, as well as operation of some high-speed devices. The rapid scan rate of the new Ocean FX™ spectrometer enables this flicker to now be evaluated easily and economically in the field. We looked at several everyday light sources with the Ocean FX™ to see what’s happening to their intensity and color in real time.
Through a phenomenon called “persistence of vision,” the retina continues to report the presence of a source of light for 40-50 ms after it has disappeared. You see it when you wave a sparkler in the dark, as if the eye is performing some averaging of the light signal it receives. By nature, we’re more likely to see a rapidly moving object – on time scales as short as 13 ms for some, like pro athletes – but variations in intensity and color at those same time scales are harder to perceive.
That doesn’t mean that they’re not important. Studies have shown that flicker at frequencies up to 2000 Hz can impact physiology and cognition. Low frequency flicker (often perceived as flashing, blinking or strobing) can be perceived at frequencies from 3-70 Hz, and can cause seizures in sensitive people (about 1 in 4000). Frequencies 100-120 Hz above the visible threshold can cause headache and eyestrain in a portion of the population in the short term, and has been shown on average to reduce performance of visual tasks performed both on paper and in interaction with CRT screens.
The type of light source exhibiting the flicker is not as important as the specific flicker characteristics: frequency, amplitude and chromatic variation being key parameters, as well as the observation conditions (contrast, viewing distance, area of the retina being stimulated). While this has been difficult to measure previously, the new Ocean FX™ spectrometer offers the speed and sensitivity to put these spectroradiometric measurements well within reach. With measurement rates up to 4,500 scans per second and a sensitive CMOS detector responsive from 200-1100 nm, a radiometrically calibrated Ocean FX™ spectrometer can be used to characterize the intensity and color of a light source at integration times from 10 µs to 1 second, making it a powerful tool to enable researchers to investigate a range of neural and behavioral effects of flicker on at-risk populations.
Light source flicker is also important in videography. When running at very high camera frame rates, some frames will not have a consistent number of light pulses per frame – these frames will exhibit flicker. This can be avoided with high wattage bulbs, in which the high filament temperature mitigates the cooling between cycles that causes flicker, but is important for low wattage bulbs. Barcode scanners can also be impacted by flicker – if a room’s light source is flickering at a frequency similar to the barcode scanners’ carrier, the flicker interferes with the pulsed detection of the scanner, and the scanner will not function.
To dig into this deeper, we decided to look at the time resolved spectra, correlated color temperature, and xy color coordinates of the following common lighting sources:
- overhead fluorescent lighting
- compact fluorescent desk lamp
- smart phone flash
- white home-use LEDs
- home halogen lights
Measurement Setup
We radiometrically calibrated an Ocean FX™ spectrometer covering 200-850 nm with an HL-3P-CAL lamp. The Ocean FX™ was configured with a 1 m long, 400 µm core Vis-NIR fiber and a CC-3 cosine corrector, giving it a Lambertian field of view. The lamp was warmed up for 25 minutes prior to irradiance calibration with OceanView software.
Various home lighting devices were observed using the CC-3 cosine corrector, without any additional optics. All light sources measured had been on for some time, providing steady-state output. The integration time of the spectrometer was set to 100 microseconds, the cosine corrector was held against the light source, and continuous spectra were recorded for a total of three seconds. Dark spectra were also recorded for the spectrometer with the same settings in separate runs, and were subtracted from each scan prior to application of the irradiance calibration by the software.
Fluorescent Lighting
The first fluorescent lights introduced had extremely high flicker, which through the development of modern electronic ballasts has reduced flicker to 1-20% typically.
To explore this, we measured three fluorescent light bulbs housed in the same overhead light fixture. As expected, we saw a series of strong mercury lines at 405 nm, 436 nm and 546 nm, as well as other gas emission lines and some additional, broader peaks. As expected, we clearly saw a 100 Hz oscillation due to the AC power supplied (measurements were performed in Germany, where line frequency is 50 Hz). The oscillation observed is at twice the line frequency, as both the positive and negative current direction emit light.
What is interesting to observe is that not all wavelengths oscillate equally “deeply” — i.e., the 405 nm and 436 nm mercury lines oscillate all the way to zero, while the other lines only dip between about 70% (611 nm) and maybe 30% (544 nm). While the plot was limited to just 50 ms to show the traces clearly, we recorded 10 seconds of oscillations, which would allow analysis of the entire length to look for spikes or other irregular blinks.
It is also interesting to note that all but the 405 nm and 436 nm mercury lines reach their minima at different times. These oscillations are phase-shifted relative to each other, which means that the color temperature must oscillate as well. As the spectrometer used was radiometrically calibrated, we then performed calculations to determine the color temperature of the light source as a function of time. Interpolating the spectrum in 1 nm steps, the tristimulus (XYZ) values were calculated, as well as the color temperature (Robertson approximation). Plotting the resulting color temperature over time, we see a significant swing at the same oscillation frequency. This is also borne out in a plot of the chromaticity (xy color coordinates) of the overhead fluorescent lamp over time.
The black line on the chromaticity diagram indicates standard blackbody color values (the actual definition of a color temperature), with the black dots indicating color temperatures of 2000 K, 4000 K and so on. The dark blue line tracing the yellow portion of the chromaticity diagram shows the color value of the fluorescent lights as they cycle through the 50 Hz AC oscillations – a fairly wide swing in perceived color!
The same series of tests were repeated with two other bulbs in the same overhead lighting fixture, with very similar results. Performing the same series of tests on a compact fluorescent desk lamp showed the same mercury lines, although with different relative intensities (UV peaks were stronger). In addition, the desk lamp had a stronger, broader background peak spanning 400-550 nm. While we still saw the 100 Hz oscillations, the depth was far less than observed in overhead fluorescent lighting. The observed color temperature oscillated from 6200 K to 7400 K at the same frequency, with sharp peaks falling off quickly. As regards color, the desktop fluorescent lamp looked much more like a true blackbody, sitting on the blackbody line with minimal variations over time.
Smart Phone Flash
Next we tested the time and spectral behavior of a smart phone flash, again with the calibrated Ocean FX™ spectrometer. Since a phone flash is transient, we measured a series of flashes in sequence, plotting the data for each over time. An example spectrum and time plot for one flash (spanning ~10-50 ms) is shown below. Its intensity is remarkably stable!
While the spectral stability of the flash appeared quite high, we were curious to look at it more closely. A color temperature plot over time showed a slight upward trend in color temperature, roughly 500 K over 15 ms. This was supported by high color consistency as shown in the very stable chromaticity diagram plot. Zooming in, we can see that the flash color varied by <0.02 in x and y over the lifetime of the three flashes measured (red, green and blue traces).


