Vibrational spectroscopy is widely used for the non-destructive characterization of materials. As light interacts with the material, molecules bend and stretch creating vibrations specific to the chemical bonds and functional groups within the material. These vibrations give rise to a unique spectral fingerprint that can be used to characterize and even identify the material analyzed.
Vibrational spectra are measured using either Raman or infrared spectroscopy techniques that differ based on the specific light interaction measured. Raman measures the inelastic scattering of monochromatic laser light while infrared spectroscopy measures the absorption of infrared wavelengths. These complementary techniques have their strengths and weaknesses, with both techniques often used together for more complete characterization of the material.
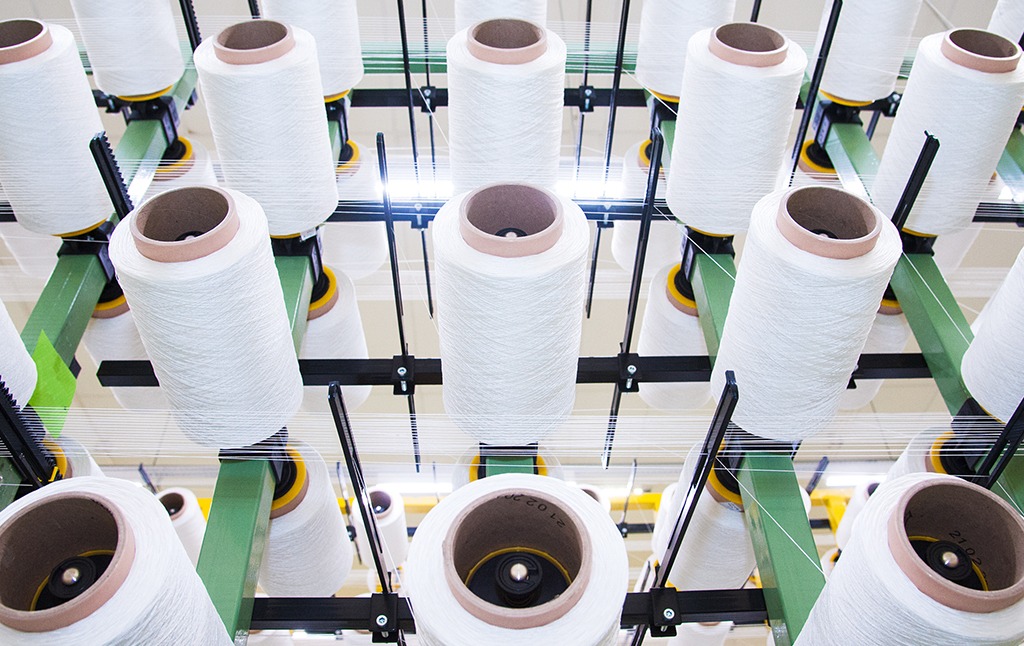
Both Raman and infrared spectroscopy techniques have been used to characterize textiles and fabrics for incoming inspection of raw materials and to assess the authenticity of products produced from these materials. In the case of colorful textiles and fabrics, infrared spectroscopy is sometimes preferred to Raman to avoid the strong Raman background spectrum that can arise from the dyes found in brightly colored textiles.
For this analysis, the NanoQuest, a miniature Fourier transform near-infrared (FT-NIR) spectrometer covering the 1350–2500 nm (7400–4000 cm-1) wavelength range, was used to measure extended-range NIR spectra for several textiles.
Experimental Conditions
To demonstrate the power of the NanoQuest spectral sensor for identifying and discriminating textiles, we measured reflectance from 8 different textile samples across the extended NIR wavelength range (1350–2500 nm). Out setup comprised the NanoQuest (NANOQ-2.5), a high-powered tungsten halogen light source (HL-2000-HP), and a NanoQuest reflection probe (NANOQ-RPROBE-600-VIS-NIR). .
Measurements were made with the probe oriented at 90 degrees relative to the fabric surface using a manual optical stage (STAGE). All measurements were referenced to a diffuse reflection standard (WS-1).
The resolution was set to 8 nm (FWHM) in the NanoQuest software and a custom gain setting was generated to optimize the signal to noise ratio for the setup used for these measurements. Each sample was measured at 5 different locations with average spectra reported in the plots in Figures 1-2. Additional analysis was done on the cotton, nylon and satin fabrics with spectral data pretreated by a 2nd derivative with smoothing and standard normal variate (SNV). Principal component analysis (PCA) was applied to this limited dataset.
Results
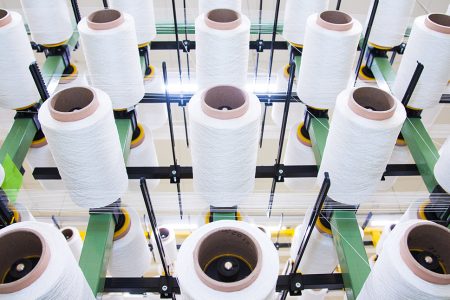
Reflectance for 8 different textile samples was measured using the NanoQuest. Textiles varied in color, thickness, and surface roughness with no two fabric samples sharing the same color. Textile color ranged from white (rayon) to dark brown (polyester). The textile labeled “PET fiber” is a sustainable textile (polyester) made from recycled plastic bottles (polyethylene terephthalate, or PET).
While there were some spectral similarities, the 8 textile samples had many differences in reflectance that could be used to discriminate and identify the textile types (Figure 1). Note that the reflectance spectra have been offset to enable a comparison of spectral features.

Figure 1: Comparison of the NIR reflectance spectra for 8 different textile samples.
Additional data analysis was done on a subset of the fabrics – cotton, nylon, and satin. The average reflectance spectra for these fabrics were pretreated by 2nd derivative and standard normal variate (SNV) methods; this normalized the relative spectral “shape” of each sample to better visualize statistically significant differences. Principal component analysis (PCA) was then applied to this limited dataset.
Figure 2 shows the spectra of the three textiles measured with the NanoQuest: cotton, nylon, and satin. Differences in the spectral profile for each sample are readily seen with the PCA plot (inset) showing the distinct separation between the clusters for each textile sample.

Figure 2: Comparison of the three textile samples measured with NIR reflectance with inset PCA scatter plot after pretreatment by 2nd derivative and SNV.
These measurements clearly demonstrate that the NIR spectra measured with the NanoQuest exhibit unique features, which help to identify both natural and synthetic textiles. The application of PCA to the spectra further demonstrates the distinction between a subset of the textile samples. Further tests will include additional data analysis using the wide range of algorithms available in the Ocean Intelligence machine learning software as well as testing with textile blends and mixtures.
Conclusions
Like so many other products, textiles are subject to counterfeiting with synthetic and low-quality raw materials sold as high-value natural products. Manufacturers and consumers are more conscious than ever of the correlation between price and the quality of the textiles they are buying, but with increasing prices and more variation in textile type and quality, counterfeit textile products are becoming more common. Whether evaluating clothing or carpeting, consumers must be wary of material made from synthetics being sold at natural textile prices.
A simple device like the NanoQuest could provide rapid testing and authentication of raw materials and textile products. This would provide manufacturers and consumers with a method to confirm the source and identity of textiles and products they are purchasing at premium prices.