Modular Spectroscopy for Dermal Measurements
Obtaining accurate, repeatable assessments of dermal characteristics is the key to many studies into the efficacy and impact of ingested and topical drugs affecting pigmentation. Spectral reflectance measurements offer an objective way to measure skin throughout dermatological studies, providing quantitative data on color and absorbance of skin. Ocean Optics modular products offer the flexibility to design a measurement system for a wide variety of dermal studies, both at and beyond visible wavelengths, from the UV to the near infrared.
By way of demonstration, we simulated the development of models for melanin and moisture in skin. We began by identifying which spectra make up the total reflectance spectrum of skin, then developed very simple models to report a “Melanin Index” and “Moisture Index” using just a few wavelengths each.
Melanin versus Hemoglobin: Two Important Contributors
Melanin is a dark pigment found in skin, contributing to skin tone and responsible for protection from solar radiation and the visible tanning of skin upon exposure to UV light. Surprisingly little is known about melanin, despite its key role in skin pigmentation. Melanin is the name for a group of insoluble biopolymers with various structures that have proven difficult to isolate and study1. Melanin exhibits an unstructured absorbance in the visible portion of the spectrum that falls off exponentially with increasing wavelength. Despite its lack of structure, melanin could potentially be quantified spectroscopically using chemometric analysis.

Hemoglobin and deoxyhemoglobin are iron-containing metalloproteins responsible for oxygen transport in the body, and as such are found co-located with melanin in tissue. The visible spectrum of hemoglobin exhibits characteristic peaks at ~540 nm and ~580 nm, while deoxyhemoglobin peaks at ~560 nm. A pulse oximeter uses the difference in these two spectra to measure the oxygenation of blood using algorithms that are already very well understood.

The spectral absorbance of skin is heavily influenced by all three compounds: melanin, hemoglobin and deoxyhemoglobin. Skin from different regions on the body shows varying proportions of these compounds, as can be seen in the examples below.
Case 1: Reflection spectra (below) of dorsal forearm skin in five individuals varying from light to dark skin tone shows significant variation across the visible and near infrared wavelengths. Note that hemoglobin absorption peaks are weak in this region, likely due to smaller blood vessels and the presence of tissue components that mask the hemoglobin spectral features.

Case 2: Spectra of neck skin (below) in reflectance as measured close to the carotid artery shows strong hemoglobin absorbance peaks at 540 nm and 580 nm in subjects with lighter skin tones. These peaks are much less pronounced in individuals with darker skin tones, likely due to absorbance of melanin and other skin components.

While the choice of sampling location is critical when performing spectroscopic measurements, chemometrics can aid in separating the contribution of these various spectral components, facilitating more accurate assessments of melanin content in skin regardless of location. With this goal in mind, we measured the spectra of skin in several regions of the body, from the UV to the NIR, in an effort to develop a simulated model of melanin and moisture content.
Experimental Method
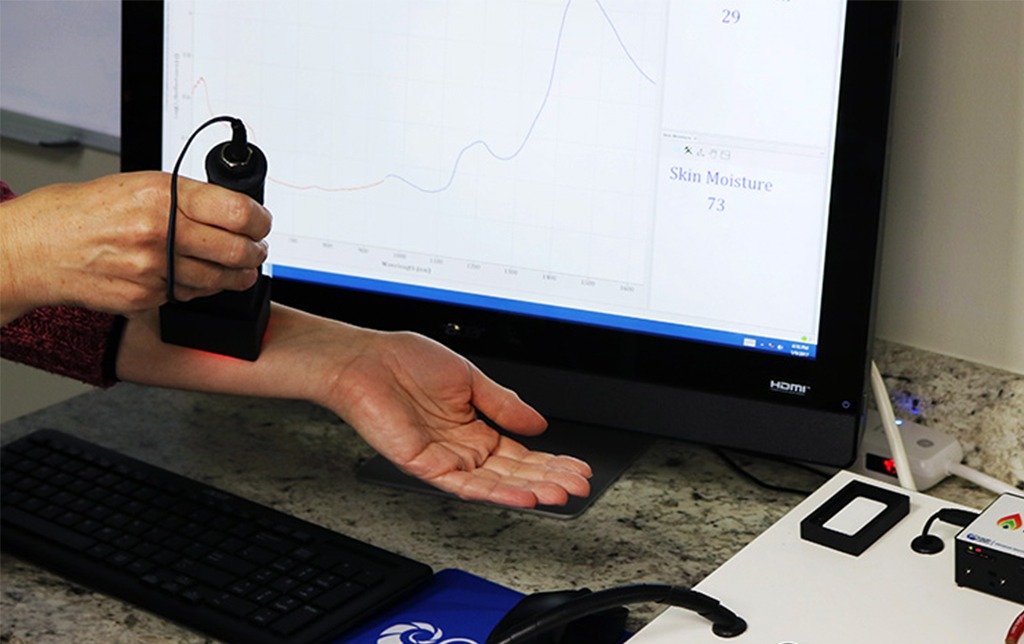
A dual spectrometer system was created to facilitate measurements from the UV through NIR, using the components below. A single UV-Vis-NIR light source was used for illumination, with UV-Vis and NIR fibers collecting reflected light separately for routing to the corresponding spectrometer.
- DH-2000-BAL balance deuterium-tungsten halogen light source
- QR200-12-MIXED UV-Vis-NIR combination fiber probe at 45°
- RPH-1 reflectance probe holder
- Flame-S-XR1 spectrometer (200-1025 nm)
Integration time: 200 ms
Averages: 3
Boxcar: 3 - Flame-NIR spectrometer (950-1650 nm)
Integration time: 600 ms
Averages: 1
Boxcar: 0
Skin reflectance was measured from 200-1650 nm at three locations: palm, forearm inside, and forearm top. One hundred spectra were collected at each location, yielding a total of 300 spectra. The spectra were recorded continuously, moving in in no particular pattern and pausing for a few seconds at each location until the desired number of spectra were recorded.

Melanin Analysis Part 1: Determining Concentration
A properly applied chemometric analysis would correlate parameters measured physically in the lab to the spectra acquired for the same samples, as described in our application note, Chemometric Analysis of Food Quality. As Ocean Optics is not equipped or properly licensed to measure hemoglobin or moisture in skin via chemical methods in the lab, we used an iterative procedure, MCR-ALS (alternate least squares multivariate curve resolution) to separate the spectra into meaningful chemical spectra in order to define our “concentrations.”
In skin, we expect to see a number of dominant chemical components:
- Melanin
- Oxyhemoglobin
- Deoxyhemoglobin
- Protein
- DNA
- Water
- Corneum (dead top layer of skin)
However, just as blood is both water and hemoglobin, some of these spectra might be coupled (i.e., correlated) and hard to separate. We might also not have enough variation in some of the parameters to identify them. Applying MCR-ALS, we found through trial and error that four components provided the best fit. Looking at the modeled spectral curves for these four components (see graph), component 1 (in green) appeared similar in shape to the known spectrum for melanin.

Component 2 (in orange) was found to be strongest on the back of the forearm and especially in the palm of the hand. Looking at the inside of the hand, the skin is thicker there, with a higher proportion of corneum. It may therefore correspond to the upper layers of the skin, which have lower water content (as indicated by the lower water absorbance peak in the NIR). Component 2 shows some cross-correlation with the hemoglobin peaks in the visible region, but that is to be expected when applying a very simplistic analysis model to such a complex matrix.
Based on the peaks between 500-600 nm and in the NIR, components 3 and 4 appear to represent a mix of hemoglobin, deoxyhemoglobin and water. No effort was made to measure skin that was predominantly oxygenated or deoxygenated, and thus we would expect these to be coupled.
Melanin Analysis Part 2: Developing the Prediction
Taking the extracted concentrations for melanin as our new ground truth, we performed PLS-type chemometrics on our 300 spectra for melanin. A five-component PLS model resulted in the best quality fit, predicting melanin concentration quite well (as can be seen below).

Knowing that we could reasonably predict melanin concentration with full-spectrum PLS modeling, we attempted to replicate our success with just four wavelengths. Carefully avoiding the known hemoglobin and deoxyhemoglobin absorbance peaks in the range 520-600 nm, we found 400 nm, 450 nm, 490 nm and 700 nm to be the most promising wavelengths for predicting melanin concentration.
In fact, our four-wavelength PLS model based on these wavelength selections resulted in very good correlation between “measured” and predicted melanin concentrations, comparable to what we found with the full spectrum.

Combining the absorbance at these four wavelengths as below therefore results in a fairly good “Melanin Index,” or approximation of melanin concentration in skin:
Melanin Index = Abs410 – 2*Abs450 + 2*Abs490 – Abs750
Moisture Analysis
Development of a moisture index was much simpler, as water has a strong absorbance peak at 1465 nm, which can be referenced against a dip at 1300 nm:
Moisture Index = 100*(Abs1465 – Abs1300)
Conclusion
By measuring reflectance in skin over the visible and NIR range, it is possible to develop fairly simple multi-wavelength models for melanin and moisture concentration to facilitate studies of skin.

Perform Your Own Reflectance Measurements of Skin
HL-2000 – Tungsten halogen light source with continuous output from 360-2400 nm
QR200-12-MIXED – Expanded wavelength coverage reflection probe for simultaneous UV-Vis and Vis-NIR measurements
RPH-1 – Probe holder for measuring reflection of surfaces at 45°
Flame-S-VIS-NIR – Vis-NIR spectrometer with Sony ILX511b detector for measurements from 350-1000 nm
Flame-NIR – Small footprint NIR spectrometer with uncooled InGaAs detector for measurements from 950-1700 nm
References
1. Zonios, George, et al. “Melanin absorption spectroscopy: new method for noninvasive skin investigation and melanoma detection.” Journal of biomedical optics 13.1 (2008): 014017-014017.